Every parking facility operator who considers a barrier gate system faces the same question from their finance team: when does this thing pay for itself? The answer depends on the facility, the current state of operations, and what you count as a return. But the framework for calculating it is straightforward, and the numbers almost always favor gating, especially at facilities that currently operate with little or no access control.
This guide provides a step-by-step method for calculating barrier gate ROI and payback period, with the formulas, benchmarks, and real-world variables you need to build a credible business case.
Why ROI Matters More Than Price
Operators frequently compare barrier gate systems by sticker price. A $4,000 gate mechanism looks cheaper than a $7,000 one. But the mechanism is a fraction of the total system cost, and total system cost is only meaningful in relation to the return it generates.
A $50,000 system that recovers $40,000 in annual revenue has a payback period of about 15 months. A $30,000 system that recovers $15,000 annually takes two years. The “cheaper” system is actually the worse investment.
ROI analysis shifts the conversation from “how much does it cost?” to “how much does it earn, save, and protect?” That reframing is essential for getting capital budget approval.
The ROI Formula
The basic payback period formula is:
Payback Period (months) = Total System Cost / Monthly Net Benefit
Where:
- Total System Cost = hardware + software + installation + integration + first-year maintenance
- Monthly Net Benefit = (New Revenue + Cost Savings + Loss Prevention) - Ongoing Monthly Costs
The more detailed return on investment percentage:
ROI (%) = (Annual Net Benefit - Annualized System Cost) / Total System Cost x 100
Both formulas are useful. Payback period answers “when do we break even?” ROI percentage answers “what is the annual return on this capital?”
Step 1: Calculate Total System Cost
Start by building a complete cost picture. Operators who undercount costs end up with a payback period that looks too optimistic, which damages credibility with finance stakeholders.
| Cost Category | Typical Range | Notes |
|---|---|---|
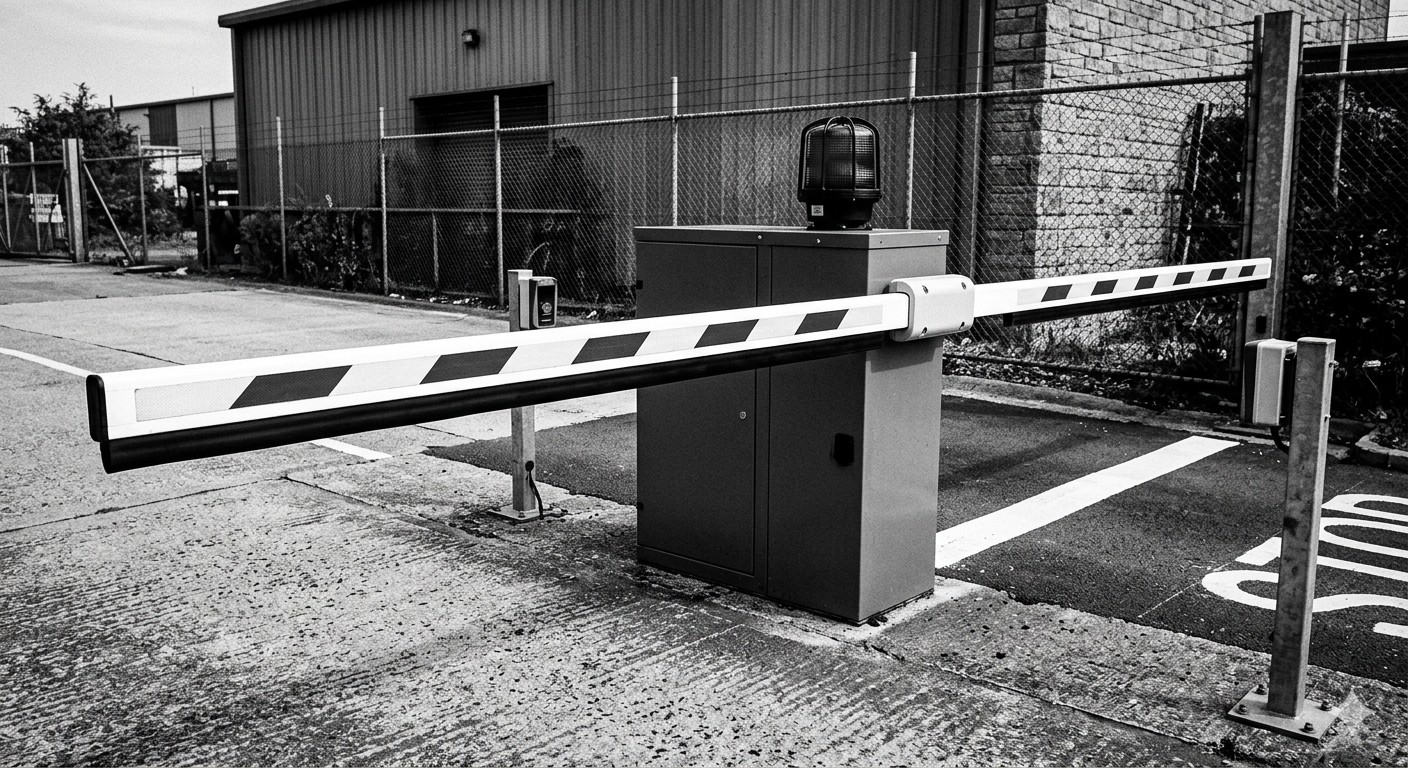
| Barrier gate mechanisms | $3,000 - $8,000 per lane | Higher-speed units cost more |
| Access readers/dispensers | $1,500 - $5,000 per lane | Depends on technology (RFID, LPR, ticket) |
| LPR camera systems | $4,000 - $12,000 per lane | Optional but increasingly standard |
| Pay stations / kiosks | $8,000 - $25,000 each | Pay-on-foot or pay-in-lane |
| Software platform | $5,000 - $30,000 | Perpetual license or first-year SaaS subscription |
| Installation and electrical | $5,000 - $30,000 | Varies heavily by site conditions |
| Network infrastructure | $2,000 - $10,000 | Conduit, switches, wireless backhaul |
| Integration (PMS, ERP, etc.) | $2,000 - $15,000 | Custom work for connecting to other systems |
| Training | $1,000 - $5,000 | Staff training on the new system |
| Contingency (10%) | Varies | Always include this |
For a detailed breakdown of pricing by component, see our barrier gate cost and pricing guide.
Example: A mid-size commercial lot with 2 entry lanes and 2 exit lanes might have a total system cost of $85,000, including barrier gates from FAAC, LPR cameras, a cloud-based management platform, pay-on-foot kiosks, and installation.
Step 2: Identify Revenue Gains
Revenue gains come from several sources. Not all apply to every facility, but most facilities find at least two or three that are significant.
Recovered Revenue from Unauthorized Parking
This is often the largest single component. Facilities without barrier gates frequently lose 10-30% of potential revenue to vehicles that enter and park without paying. They tailgate through open entrances, use expired permits, or simply park and leave.
How to estimate: Count the number of unauthorized vehicles during a one-week audit period. Multiply by 52 weeks. Apply your average parking rate.
Example: 15 unauthorized vehicles per day x $12 average rate x 365 days = $65,700 per year in recovered revenue.
New Revenue from Previously Free Parking
Some facilities that have always offered free parking discover that a gated system enables them to begin charging, or to charge at rates the market supports. This is common at hospitals, universities, and mixed-use developments.
Increased Rate Compliance
Even paying customers may underpay in an ungated facility. Without entry/exit timestamps, enforcing hourly rates depends on enforcement patrols that are inconsistent and easy to evade. Barrier gates create exact timestamps and enforce payment at the exit.
How to estimate: Compare your theoretical maximum revenue (all spaces occupied at posted rates) against actual collections. The gap includes both unpaid and underpaid parking.
Event and Dynamic Pricing Revenue
Barrier gate systems enable variable pricing that ungated lots cannot enforce. Charging premium rates during concerts, games, or conventions can generate substantial additional revenue.
Example: A lot near a sports venue charges $10 normally but $30 on event days. With 40 events per year and 200 spaces, event pricing adds $160,000 in annual revenue.
Step 3: Identify Cost Savings
Reduced Labor
Barrier gate systems with automated payment processing reduce or eliminate the need for staffed entry and exit booths. A single attendant at $15/hour working 16 hours per day (two shifts) costs approximately $87,600 per year including benefits. Automating two lanes with pay-on-foot stations might reduce staffing needs by 1.5 full-time equivalents.
Lower Enforcement Costs
Ungated lots require regular enforcement patrols to check for violators. Gated facilities handle enforcement at the barrier. If the gate does not open, the vehicle does not enter. Enforcement labor and vehicle costs can be reallocated or eliminated.
Reduced Cash Handling
Moving from cash-heavy operations (staffed booths) to automated payment (credit card, mobile) reduces cash handling costs: armored car services, counting labor, and shrinkage (cash that goes missing).
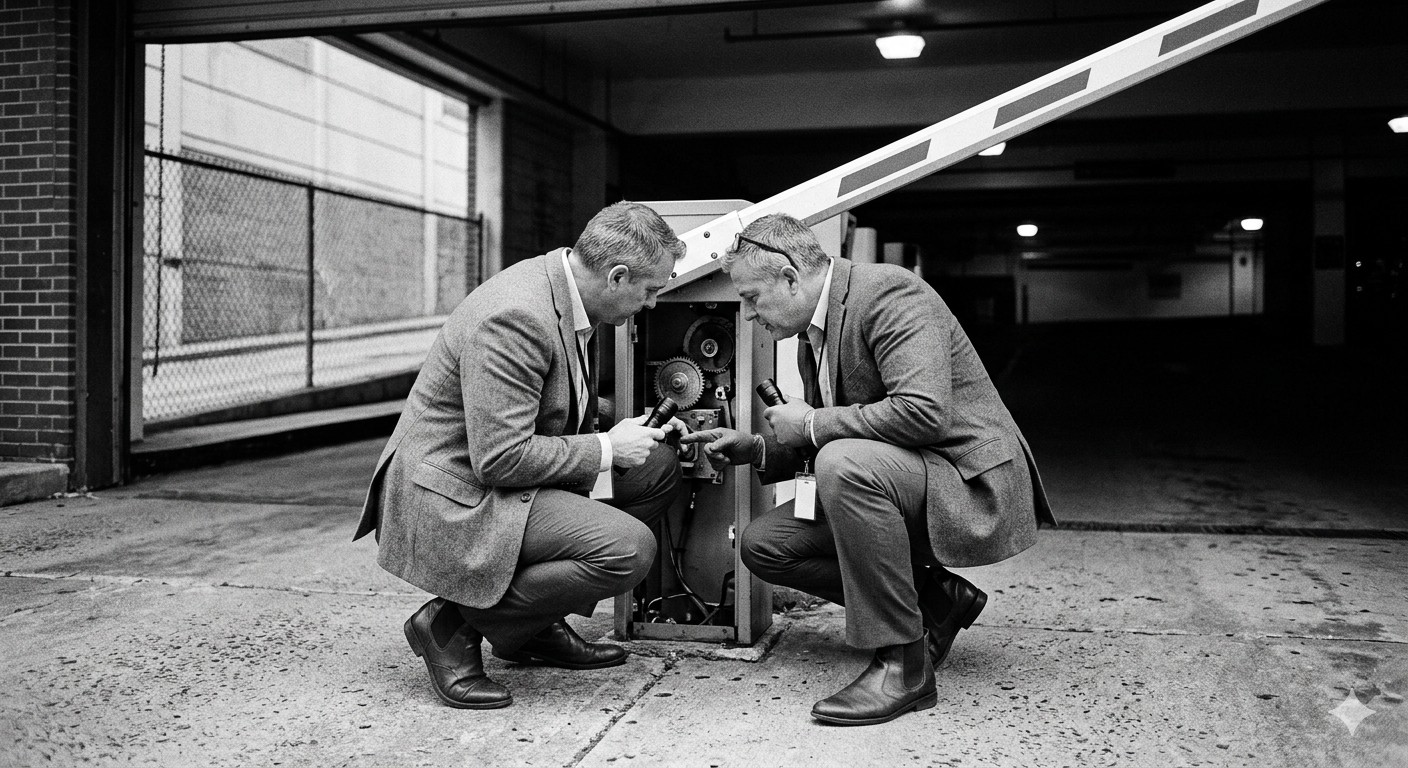
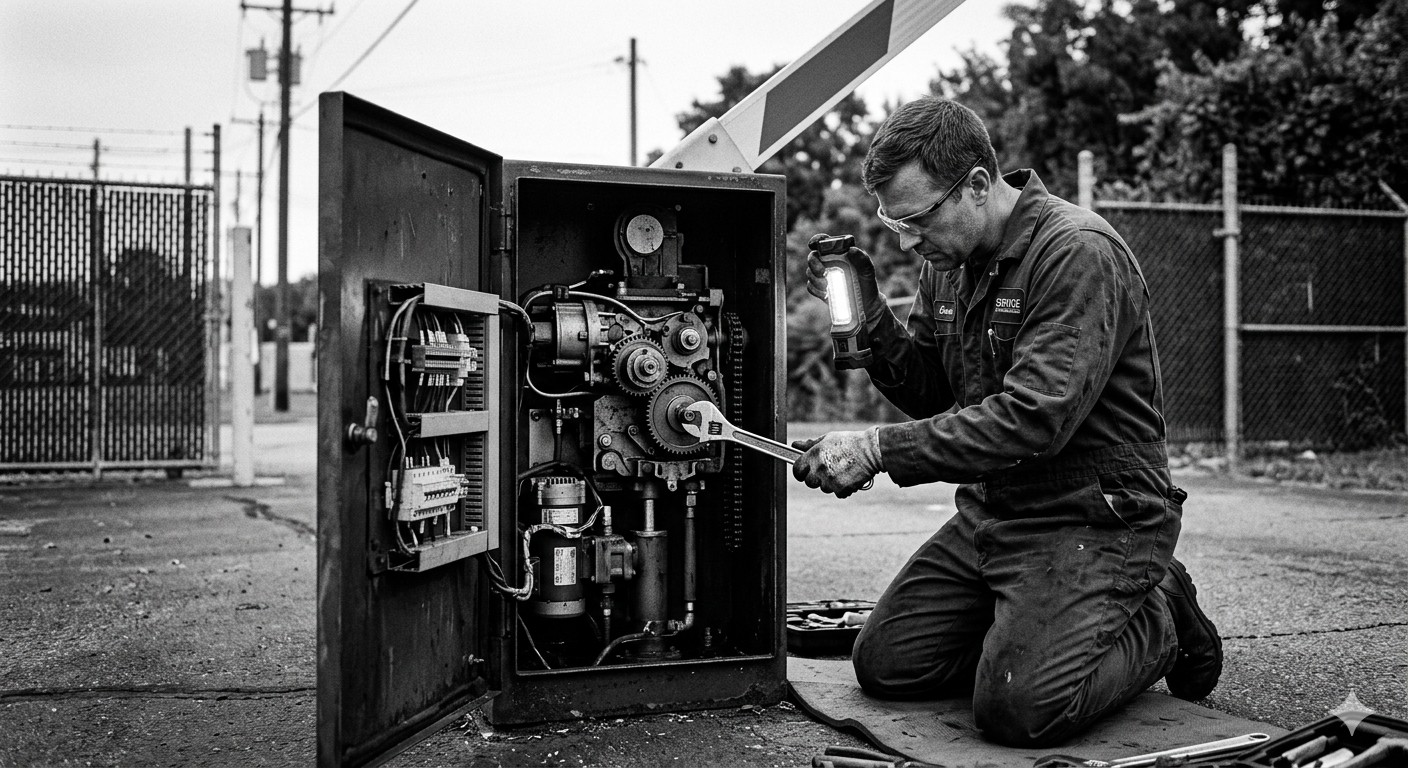
Maintenance Consolidation
Modern barrier gate systems with remote monitoring reduce the number of on-site maintenance visits. Cloud-based diagnostics can identify issues before they cause downtime, and remote configuration changes eliminate truck rolls for rate updates.
Step 4: Identify Loss Prevention Benefits
Reduced Liability and Insurance
Gated facilities with entry/exit records experience fewer vehicle-related claims. Some insurance carriers offer premium reductions for facilities with controlled access and surveillance integration. The reduction may be 5-15% on the parking facility’s liability policy.
Theft and Vandalism Deterrence
Controlled access discourages criminal activity. Vehicles in gated facilities experience lower rates of break-ins and theft. While this does not appear directly on a revenue line, it reduces claim payouts and protects the facility’s reputation.
Data for Dispute Resolution
Timestamped entry/exit records with plate images resolve disputes efficiently. Without them, the facility is exposed to claims it cannot refute.
Step 5: Calculate Ongoing Costs
The ROI calculation must account for recurring expenses:
| Ongoing Cost | Typical Annual Amount |
|---|---|
| Software subscription (cloud) | $1,200 - $12,000 |
| Preventive maintenance | $2,000 - $8,000 |
| Consumables (tickets, receipt paper) | $500 - $2,000 |
| Payment processing fees | 2.5 - 3.5% of card transactions |
| Network/connectivity | $600 - $2,400 |
| Support contract | $1,500 - $6,000 |
Step 6: Run the Numbers
Here is a complete example for a 300-space commercial parking lot.
System Cost
| Item | Cost |
|---|---|
| 2 barrier gate mechanisms (CAME) | $12,000 |
| 2 exit barrier gate mechanisms | $12,000 |
| LPR cameras (4 lanes) | $32,000 |
| 2 pay-on-foot kiosks | $36,000 |
| Cloud software (year 1) | $6,000 |
| Installation | $18,000 |
| Training and contingency | $9,000 |
| Total System Cost | $125,000 |
Annual Benefits
| Benefit | Annual Value |
|---|---|
| Recovered unauthorized parking revenue | $54,000 |
| Rate compliance improvement | $18,000 |
| Labor reduction (1 FTE) | $52,000 |
| Cash handling savings | $4,800 |
| Insurance premium reduction | $3,600 |
| Total Annual Benefit | $132,400 |
Annual Ongoing Costs
| Cost | Annual Amount |
|---|---|
| Software subscription | $6,000 |
| Maintenance contract | $5,000 |
| Payment processing fees | $8,400 |
| Consumables and connectivity | $2,600 |
| Total Annual Ongoing Cost | $22,000 |
Results
- Annual Net Benefit: $132,400 - $22,000 = $110,400
- Monthly Net Benefit: $9,200
- Payback Period: $125,000 / $9,200 = 13.6 months
- Year 1 ROI: ($110,400 - $125,000) / $125,000 = -11.7% (still paying off)
- Year 2 ROI: $110,400 / $125,000 = 88.3%
- 5-Year ROI: ($552,000 - $125,000) / $125,000 = 341.6%
This example uses conservative assumptions. Facilities with higher unauthorized parking rates or event pricing potential often see payback periods under 12 months.
Industry Benchmarks
The IPMI and the National Parking Association (NPA) both publish data on parking facility financial performance. Based on aggregated industry data:
- Typical payback period for barrier gate systems: 12-24 months
- Average revenue increase after installing access control: 15-30%
- Labor cost reduction with automated payment: 20-40%
- Facilities that achieve sub-12-month payback typically have high unauthorized parking rates or introduce paid parking where it was previously free
The Parking BOXX parking revenue calculator provides an interactive tool for estimating revenue potential, and their parking management systems page outlines system configurations at various price points. The blog.parkingboxx.com has additional articles covering financial modeling for parking operations.
Common Mistakes in ROI Calculations
Mistake 1: Ignoring Soft Benefits
Security improvements, guest experience enhancement, and data availability are real but hard to quantify. Exclude them from the core financial calculation, but mention them qualitatively in the business case. Decision-makers value them even if they do not carry a dollar figure.
Mistake 2: Using Manufacturer Revenue Projections Without Validation
Every vendor’s ROI calculator will show a favorable result. Validate their assumptions against your actual data: your vehicle counts, your current revenue, your local labor rates.
Mistake 3: Forgetting Installation Complexity
Site conditions drive installation costs. A clean, new parking structure with conduit in place is cheap to wire. A 30-year-old surface lot with no power at the lane requires trenching, electrical panels, and network drops that can double the installation budget.
Mistake 4: Comparing Against Zero
If you currently have no access control, the ROI looks enormous because you are comparing a system to nothing. That is valid, but finance teams may question whether you need a $125,000 system or whether a $40,000 system captures most of the same benefit. Model multiple scenarios at different investment levels.
Mistake 5: Ignoring the Time Value of Money
For large capital investments, a simple payback calculation does not account for the cost of capital. If your organization requires a discounted cash flow (DCF) analysis or net present value (NPV) calculation, apply your internal hurdle rate to the cash flows.
Building the Business Case
When presenting an ROI analysis to decision-makers, structure the presentation as follows:
- Current state — what the facility looks like today (revenue, costs, problems)
- Proposed investment — what you want to install, from which vendor, and the total cost
- Expected returns — revenue gains, cost savings, and loss prevention, with supporting data
- Payback timeline — month-by-month cash flow showing when the investment breaks even
- Risk factors — what could make the payback longer (lower utilization, construction delays)
- Recommendation — a clear ask for capital approval
For more on how software integration amplifies these returns, see our guide on integrating barrier gates with parking management software.
Key Takeaways
- ROI analysis, not sticker price, is the right framework for evaluating a barrier gate investment. The cheapest system is not always the best investment.
- The four pillars of barrier gate ROI are recovered revenue, new revenue, cost savings, and loss prevention. Most facilities find the strongest return in revenue recovery from unauthorized parking.
- A typical barrier gate system pays for itself in 12-24 months. Facilities with high unauthorized parking rates or event pricing potential often see sub-12-month payback.
- Build the business case with real data from your facility. Conduct a traffic and revenue audit before relying on vendor projections.
- Model multiple investment levels. Decision-makers want to see how returns scale with investment size.
- Include ongoing costs (software subscriptions, maintenance, payment processing) to keep the analysis honest and credible.